
Identifying and Categorizing Machine Downtime
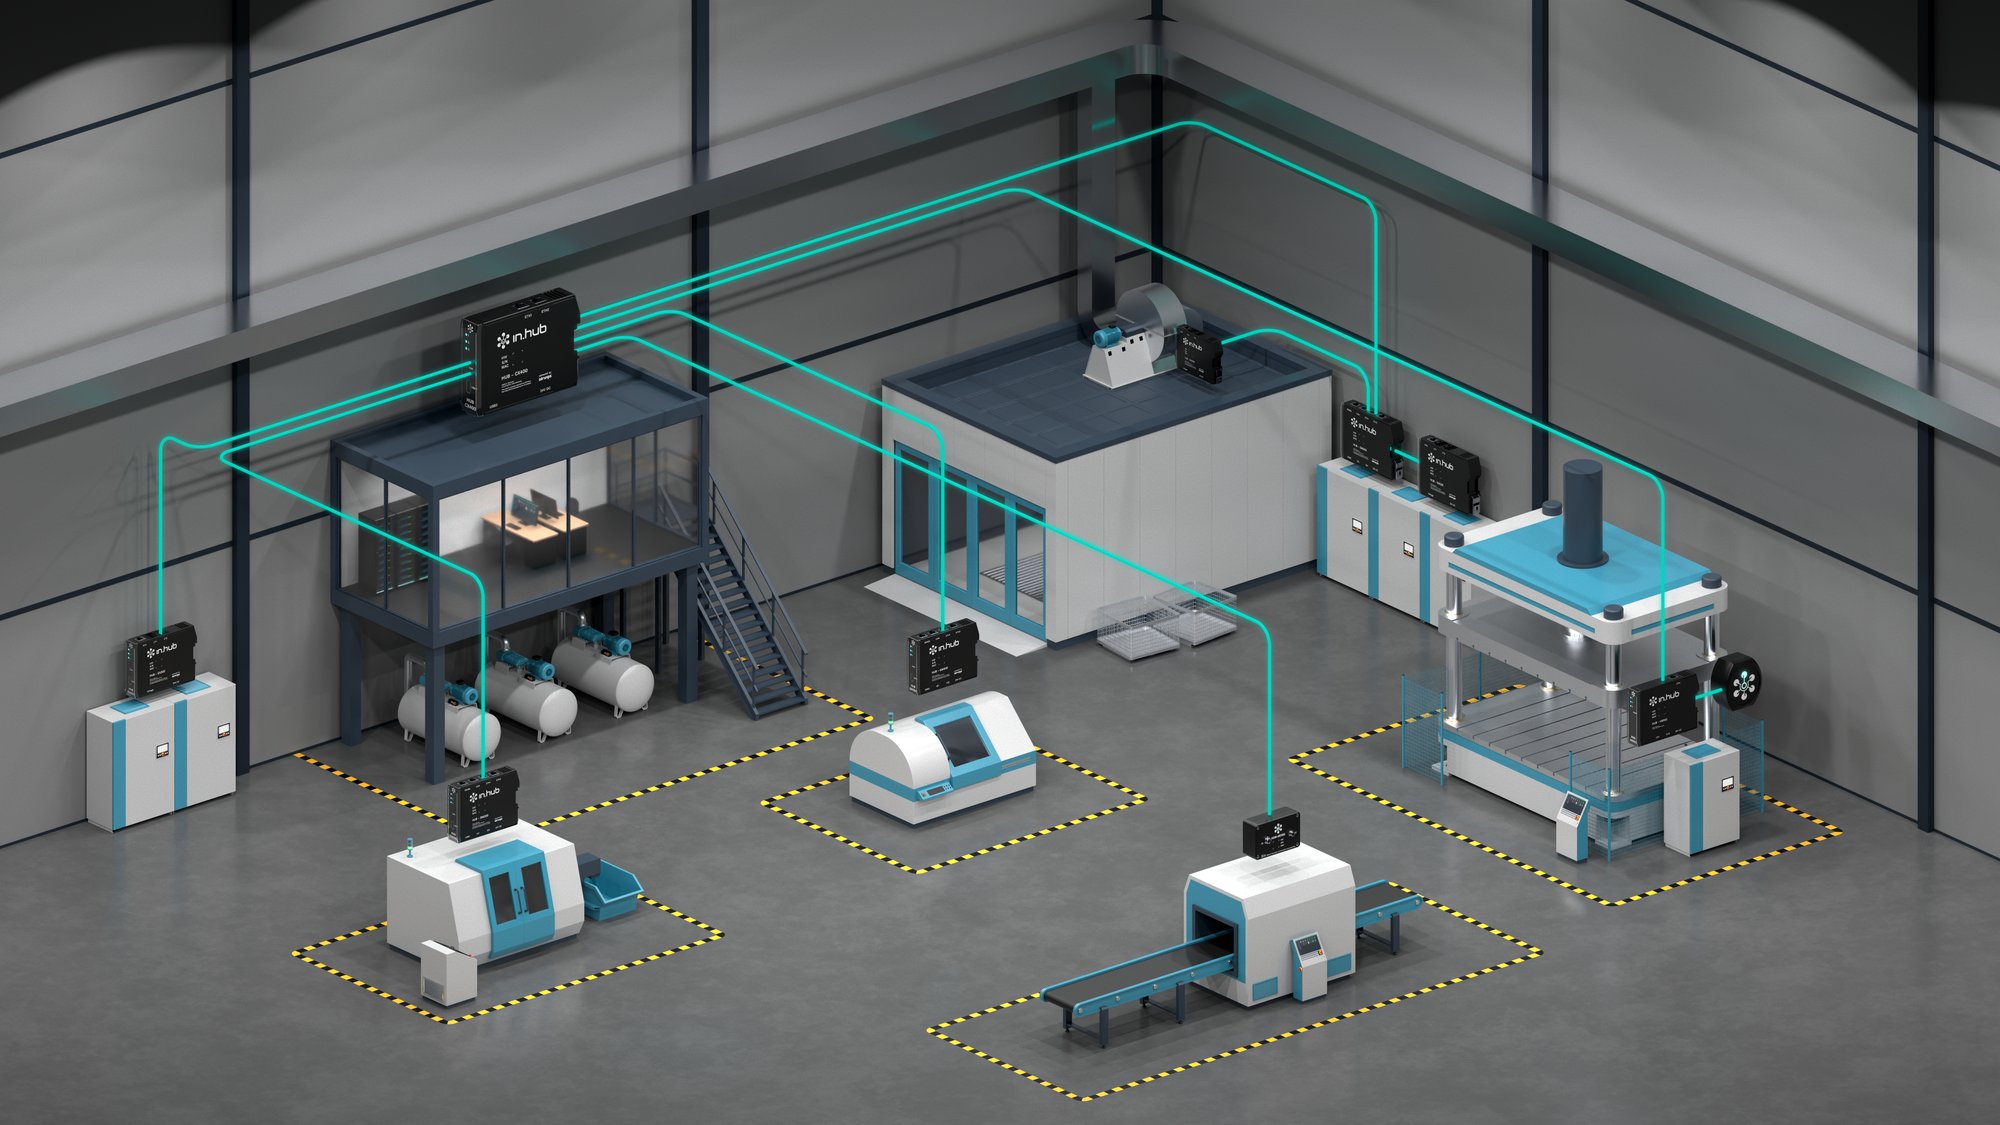
in.hub provides devices, the siineos® platform, and apps for collecting machine data directly on-site. This page shows you how to record downtime without using the cloud and assign it to specific causes.
Benefits
What You’ll Achieve
- View downtime for each individual station
- Document and export downtime causes using custom color codes
- Acknowledge malfunctions directly at the workstation using HUB-SIGNAL
Target Audience
Which Machines and Facilities It Is Suitable For
Individual machines or production lines with multiple stations where digital signals (cycle time, piece count, fault) are available at the controller. Also, machines operating in series production where individual sensors can be read or retrofitted.
Process
How It Works
-
01
Connecting Signals
Connect the digital inputs of the HUB-GM200 or HUB-IO100 to machine signals.
-
02
Connect to the network
Connect the devices on the local network via LAN or Wi-Fi. -
03
Use in a browser
Allow any browser-enabled device on the local network to access the devices and apps. -
04
Create Stations
Define the stations on a line in MaDoW and link them to the signals.
-
05
Evaluate
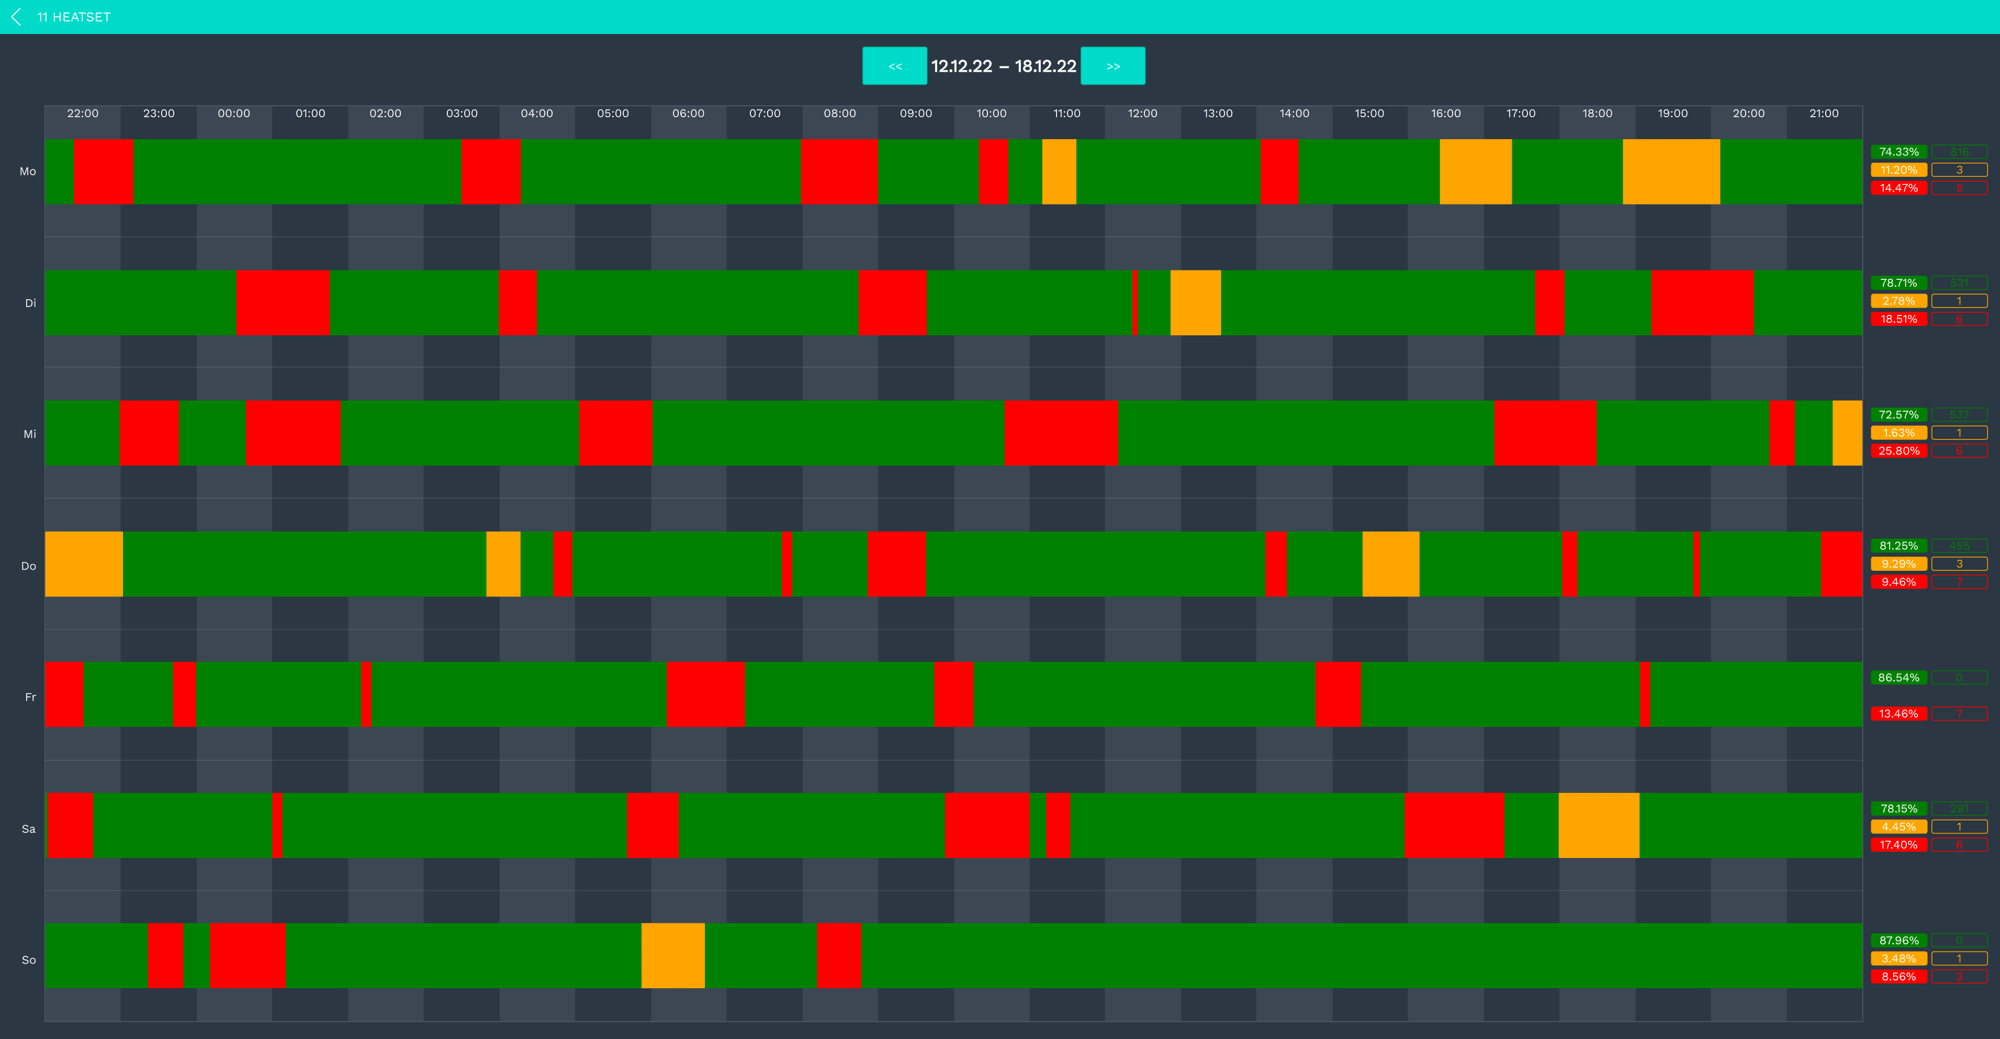
View downtime by week, day, or shift; confirm the reasons for downtime; and export the data.
Equipment
Here's what you'll usually need
Gateways
HUB-GM200
PLC connection and up to 6 digital or 4 analog inputs, plus much more, for machine signals
Modules
HUB-SE100
Connect in-line between the sensor and the PLC; the signal remains unchanged
App
MaDoW
Record and Analyze Downtime by Station
App
MaDoW MASTER
Downtime affecting multiple lines on the shop floor layout
Expansion
This allows you to expand at any time
Modules
HUB IO100
Up to 12 digital I/O ports; if more inputs are needed
Modules
HUB SIGNAL
LED status indicator and 5 buttons at the workstation, e.g., to acknowledge a fault
App
SIGNL4 Connector
Forward Alerts to the On-Call Team
Transparency
What's running locally, and what you need a connection for
| Task | Where it runs | Do you need the Internet? |
|---|---|---|
| Record, store, and analyze measurement data | on the device | No |
| View dashboards and real-time metrics | in the browser, on your own network (LAN/Wi-Fi) | No |
| Alerts When Threshold Values Are Reached | on the device; forwarding via email or SIGNL4 uses your network | For external forwarding only |
| Send data to your systems (OPC UA, MQTT, Modbus, SQL, REST) | on its own network | No |
Do It Yourself
What You Can Do Yourself
- Install devices in the system
- Configure stations and outage reasons in MaDoW yourself
- Generate reports yourself as exports
With support
Where we or a partner can help
- Identify machine signals
- Wiring the digital inputs during commissioning
- Setting up the hall layout in MaDoW MASTER
Is this right for you?
Requirements and Limitations
Works well when
- digital signals are available at the controller (clock, count, fault)
- several stations on a line are to be evaluated individually
- The PLC is accessible
It doesn't work well when
- No signal has been output from the machine yet (in which case, first identify the signal source)
- We are looking for a direct OEE metric: First and foremost, we are tracking downtime and productivity times, but not yet any quality metrics.
Result
Here’s what the results look like
Real-time data and trend charts for each machine, accessible in the browser via MaDoW—no cloud login required. Everything is stored locally on the devices. Everything is stored locally on the devices and can be connected directly to target systems such as ERP, MES, etc., at any time.
FAQ
Frequently Asked Questions
Yes, process sequences can be identified from current signals; this is often used for machine data acquisition in automation systems.
Yes, data from ERP or MES systems or work orders can be integrated for product and quantity tracking.
Yes, interactive live dashboards can be created and displayed on networked production monitors.
Yes, every in.hub device running siineos® and equipped with an Ethernet port can read data directly from Siemens S7 controllers; this includes the HUB-GM200.
Personal Introduction
Tell us about your use case.
During our first conversation, we’ll clarify your goals, existing data, and a sensible starting point. You’ll receive an honest assessment of whether and how in.hub fits your project.


Newsletter
The in.hub in.sights&tech.radar
Industry news and real-world insights from actual companies, every two to four weeks.