
Measuring Energy Consumption per Machine
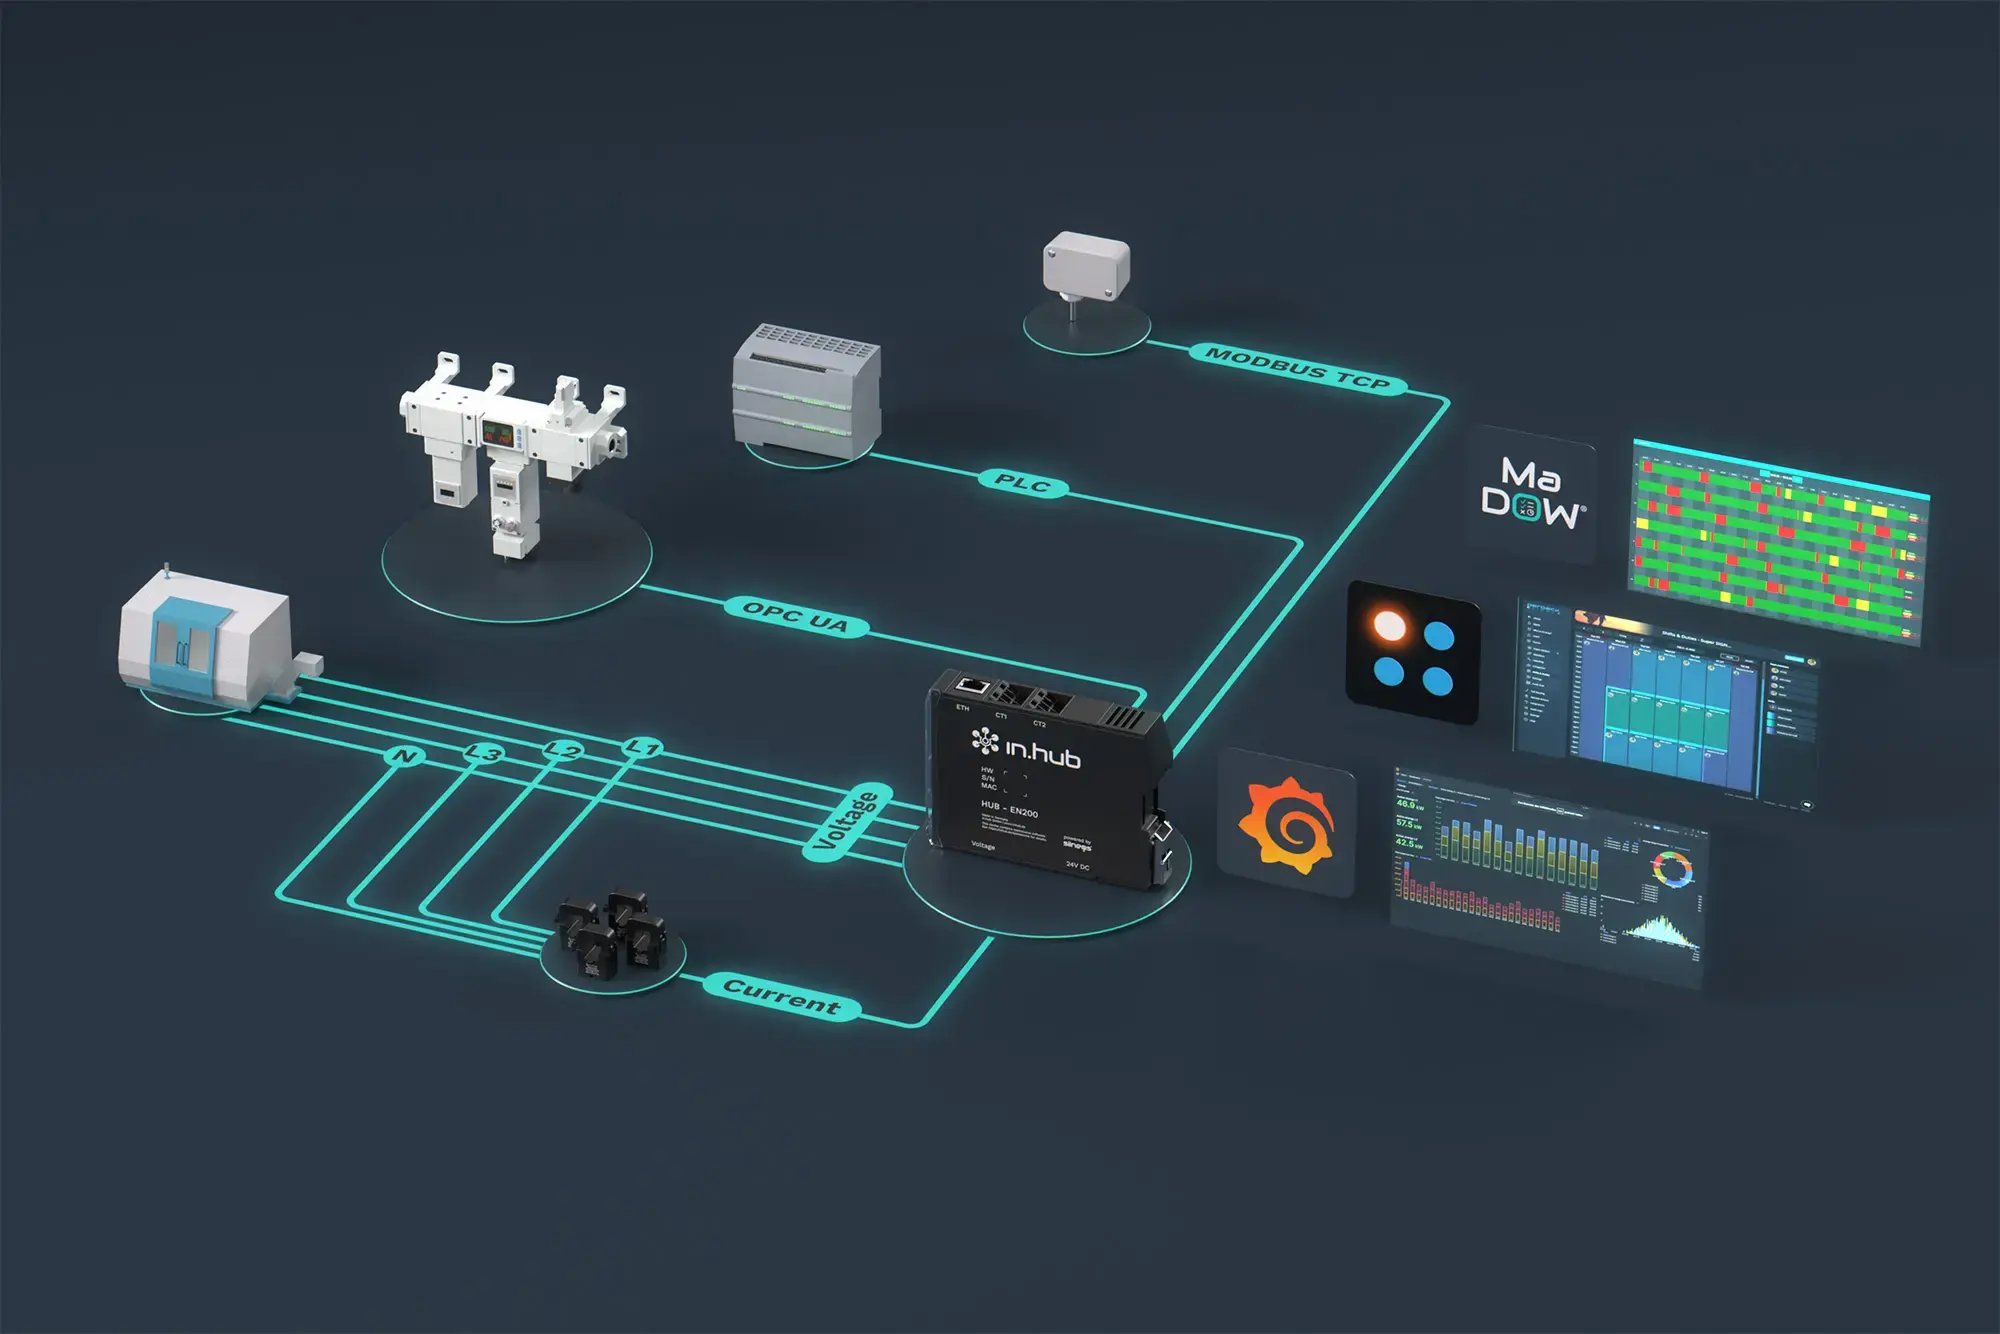
in.hub provides devices, the siineos® platform, and apps for collecting machine data directly on-site. This page shows how to use the HUB-EN200 to collect energy data directly at the machine, without the cloud. It’s also possible to integrate machine controls and other sensors directly into the system. All software runs directly on the device. No installation on end devices or servers is required.
Benefits
What You Can Achieve With It
- Track the energy consumption of each individual machine
- Identify peak loads and idle periods before they drive up the cost of electricity
- Provide data locally for ISO 50001 or internal analyses
- Measure energy holistically; compressed air measurement technology can also be directly integrated
Target Audience
Which machines and facilities it is suitable for
Production machines with 1- or 3-phase connections up to 230/400 V, in facilities that want to view energy consumption for each machine individually. Ideal for retrofitting existing and new machines. Existing energy meters with Modbus or S0 interfaces can also be connected directly to the HUB-EN200.
Process
How It Works
-
01
Install Sensors
Fold the SENS-CUR current transformer non-invasively around the wire without cutting it.
-
02
Connect the HUB-EN200
Install the module in the control cabinet, and connect the sensors and power supply.
-
03
Connect to the network.
Connect the HUB-EN200 to the local network. Connect the HUB-EN200 to the local network. -
04
Access the interface
Access the user and administration interfaces from any browser-enabled device -
05
Evaluate
View values in InGraf or FlexPlorer; forward them via OPC UA, MQTT, or SQL as needed.
Equipment
Here's what you'll need
Modules
HUB-EN200
Energy measurement module; measures currents and voltages
Accessories
SENS-CUR
Current transformers for monitoring individual loads.
App
InGraf
Grafana on your device, time series, and dashboards.
Optional
You can add this
Gateway
HUB-GM200
Only required if additional machine signals (e.g., clock signal) need to be acquired, since the EN200 does not have any digital inputs
App
FlexPlorer
Visualize signals directly
App
SQLxConnect
Write data to an SQL database
Award-Winning Solution: HUB-EN200
The HUB-EN200 with siineos has already been honored this year with the Innovation Award from the trade magazine Schaltschrankbau, as it offers more than just energy measurement.
Transparency
What's running locally, and what you need a connection for
| Task | Where it runs | Do you need the Internet? |
|---|---|---|
| Record, store, and analyze measurement data | on the device | No |
| View dashboards and real-time metrics | in the browser, on your own network (LAN/Wi-Fi) | No |
| Alerts When Threshold Values Are Reached | on the device; forwarding via email or SIGNL4 uses your network | For external forwarding only |
| Send data to your systems (OPC UA, MQTT, Modbus, SQL, REST) | on its own network | No |
| Connect a Modbus or S0 counter | Optionally with an additional gateway, HUB-IO100, or HUB-SE100 | No |
Do It Yourself
What You Can Do Yourself
- Install sensors when an electrician is on site
- Create dashboards in InGraf yourself
With support
How we or a partner can help
- Selecting the right sensor model (120/300/600 A)
- Setting up interfaces to your ERP or MES
Is this right for you?
Requirements and Limitations
Works well when
- you want to assign their consumption to individual machines
- the machine is connected to a 1- or 3-phase power supply up to 230/400 V
- in addition, the compressed air energy should be analyzed
- you want to analyze the control system data directly along with the energy data
It doesn't work well when
- if you want to analyze digital machine signals without an additional device (the EN200 has no digital inputs). But it can be expanded with any module.
- We are looking for a ready-made energy cost app: Currently, analysis is performed using InGraf and FlexPlorer; we do not yet have our own energy app. However, we are compatible with all energy management systems, regardless of the manufacturer.
Result
Here’s what the results look like
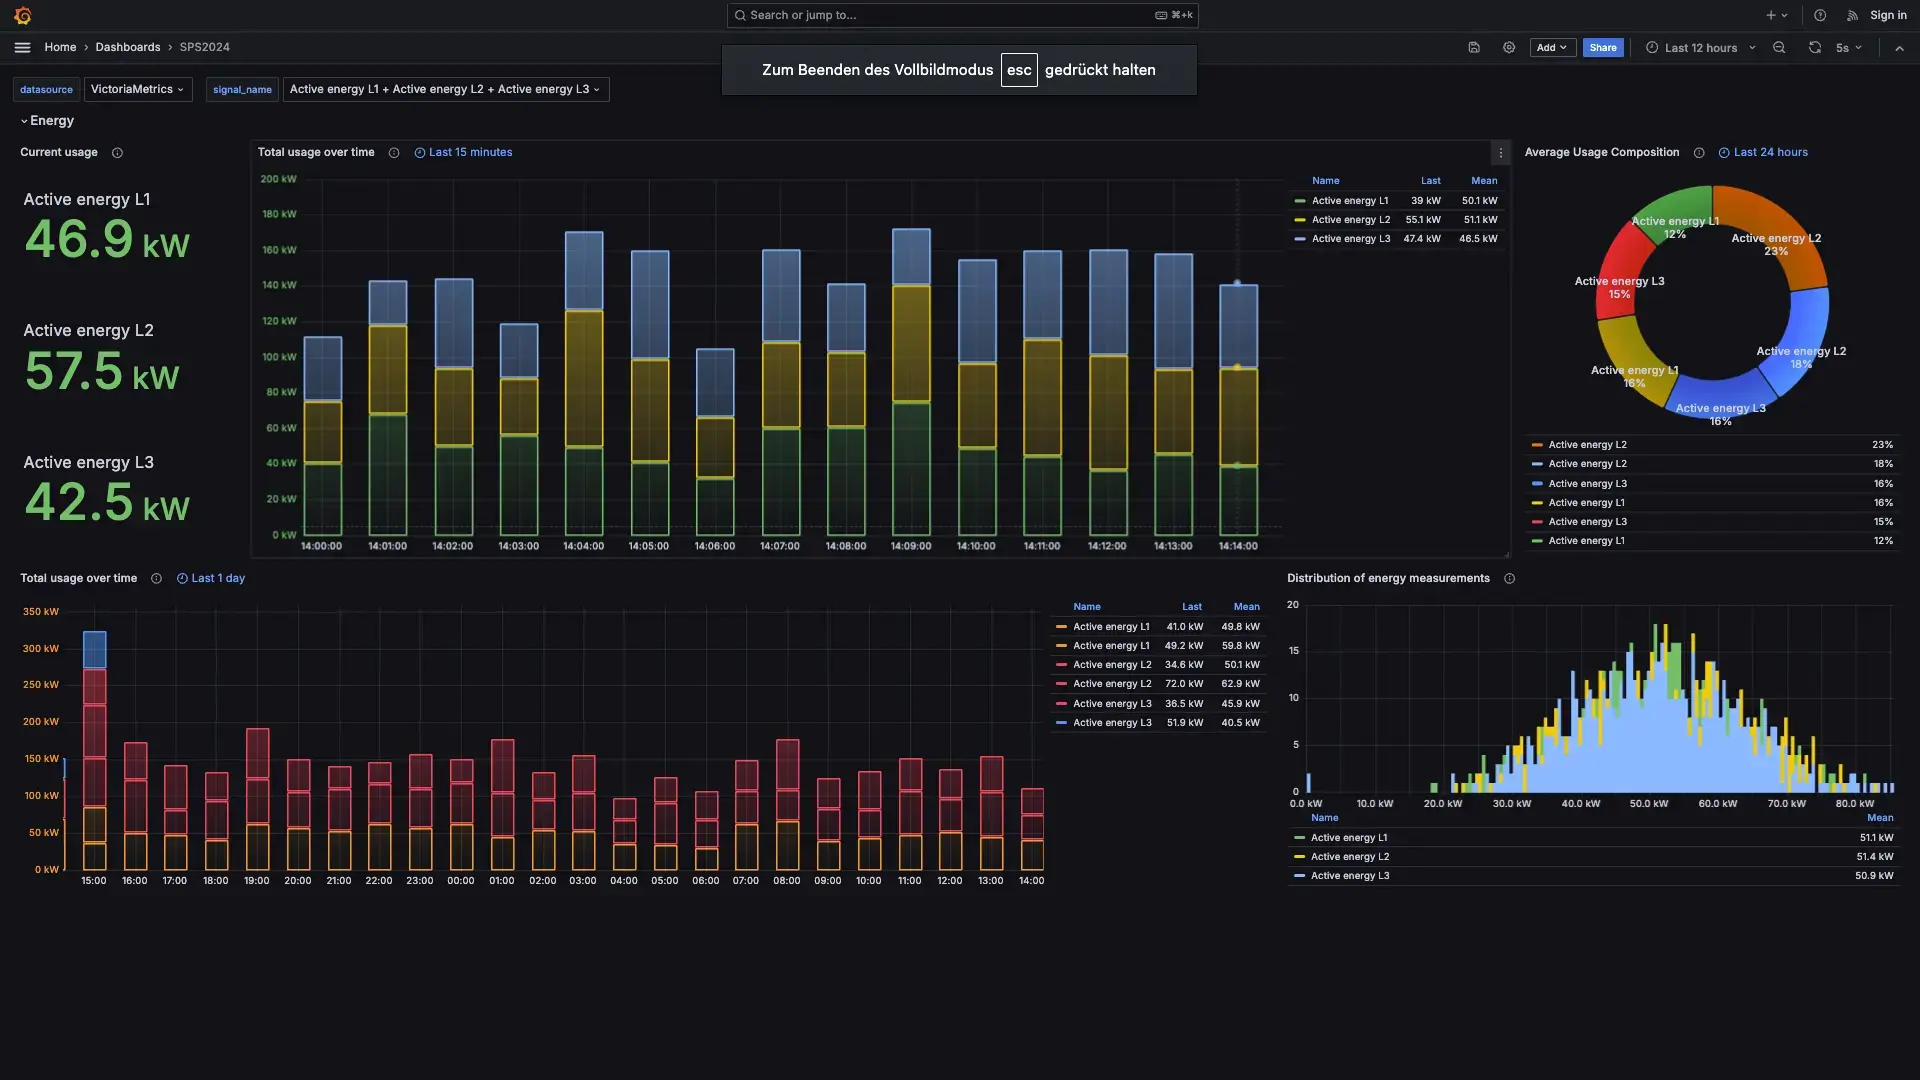
Real-time data and trend charts for each machine, accessible in the browser via InGraf—no cloud login required. Multiple dashboards can be displayed on a single device. Data resolution down to the second and storage spanning several years—all directly on the device.
FAQ
Frequently Asked Questions
Yes. Multiple HUB-EN200 units can work together with a HUB-GM200, either directly via the backplane bus or over Ethernet on the same network. Additional modules and devices can be connected via Ethernet; the size of a system depends on the network and the computational load.
Yes, threshold values trigger actions in siineos®, such as an LED indicator or a relay, via signal linking and synthetic signals.
Energy management may be eligible for funding under BAFA Module 3; under this program, hardware funding is tied to energy management software. Contact us, and we'll clarify this on a case-by-case basis.
Yes, every in.hub device running siineos® and equipped with an Ethernet port can read data directly from Siemens S7 controllers; this includes the HUB-EN200.
Personal Introduction
Tell us about your use case.
During our first conversation, we’ll clarify your goals, existing data, and a sensible starting point. You’ll receive an honest assessment of whether and how in.hub fits your project.


Newsletter
The in.hub in.sights&tech.radar
Industry news and real-world insights from actual companies, every two to four weeks.