
Complete systems
In stock
pSYS Comfort
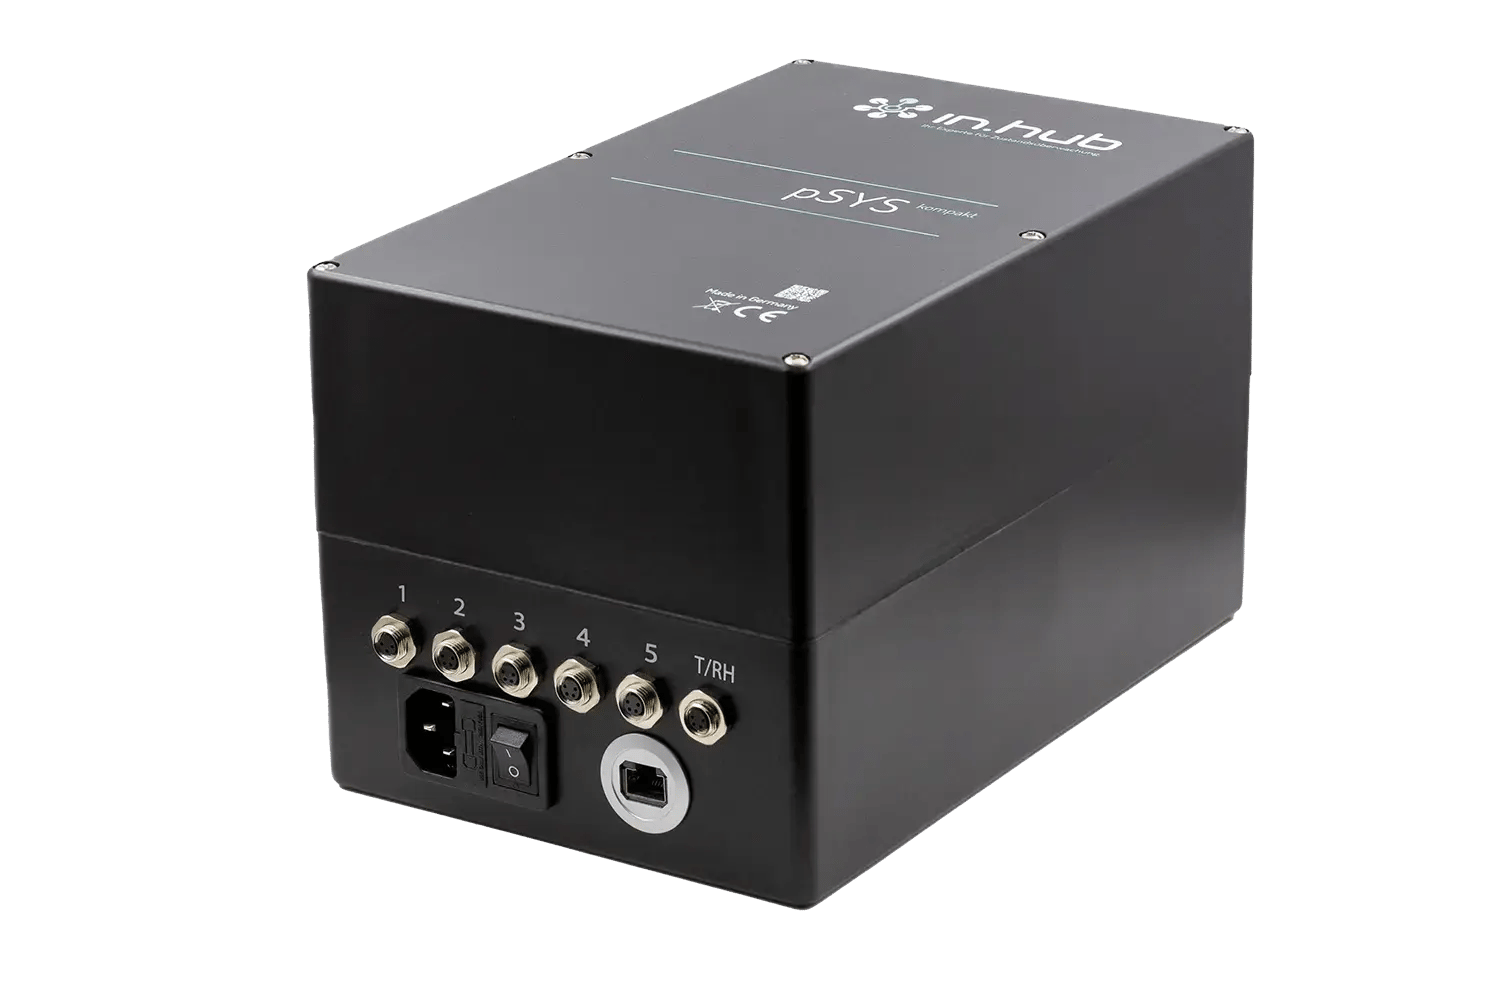
pSYS is a plug-and-play particle measurement system designed for the continuous monitoring of airborne particles, temperature, and humidity in manufacturing environments.
Overview
This preconfigured, all-in-one system—comprising hardware, sensors, and software—measures particle concentrations in the PM1.0 to PM10 ranges at up to 5 measurement points. It also measures temperature and humidity. Measurement data is stored locally and analyzed via a customizable browser-based dashboard. Alarm and reporting functions support the monitoring of environmental conditions and technical cleanliness.
Application Examples
- Monitoring technical cleanliness in production areas
- Detection of particle contamination during surface coating
- Monitoring of manufacturing environments in the electronics and semiconductor industries
- Particle monitoring in the wood and chemical industries
- Monitoring of temperature and humidity
Features
- Preconfigured plug-and-play system with siineos®
- Simultaneous operation of up to 5 particle sensors
- Measurement of particle classes PM1.0, PM2.5, PM4.0, and PM10
- Additional temperature and humidity sensor
- Local data logging with 8 GB of storage
- Fully configurable browser-based dashboard with live and historical data
- Data export, notification, and alarm functions
- Continuous 24/7 monitoring
- Integration with ERP, MES, and CAQ systems possible
- Storage
- 8 GB
- Power Supply
- 230 V ±10%, 24 V internal power supply
- Interfaces
- 1 x 1 GbE, 5 x particle sensors, 1 x temperature/humidity sensor, each with a 10-meter cable; 10-meter cable extension available as an accessory
- Particle Classes/Sizes
- PM1.0, PM2.5, PM4.0, and PM10 | 300 nm–10 μm
- Resolution
- 1 μg/m³, #Number
- Concentration / Accuracy
- 1 μg/m³ – 1,000 μg/m³ ± 10 μg/m³ @ 0 to 100 μg/m³; ± 10% @ 100 to 1,000 μg/m³
- Temperature and Humidity Sensor
- ±3% RH (30...70% RH), otherwise ±5% RH ±0.3 °C 10...90% RH at -5...55 °C
- Measurement cycle
- internal 1/second, 1/minute, 10 minutes, 30 minutes, or 60 minutes (freely configurable)
- User Interface
- Web browser on the onboard dashboard, accessible via the network from any browser-enabled device
- Temperature Range
- 0 °C to 50 °C, 0–95% relative humidity (non-condensing)
- Operating System
- siineos IIoT Operating System
- Analytics and Dashboard
- Offline dashboard with live and historical data, data export, notification and alert features, widget configuration
- Wall Mount
- Available as an accessory
- Availability
- in series
- PLC Access
- Yes, it's possible over the network
Solutions
Suitable Solutions
No solution matches this selection right now.
Particle Monitoring
in.hub provides devices, the siineos® platform, and apps for collecting machine data directly on-site. This page shows you how to continuously monitor particle levels using pSYS.
Apps
Related Apps
MaDoW
An app for tracking and monitoring machine downtime and productivity within the siineos® operating system.
MaDoW MASTER
Visualization app for displaying downtime across multiple production lines on a factory layout.
SQLxConnect
A solution for writing siineos® data directly to SQL databases without any programming effort.
InGraf
InGraf lets you visualize your data, measurements, and logs from a wide variety of data sources dynamically and in real time
Personal Introduction
Tell us about your use case.
During our first conversation, we’ll clarify your goals, existing data, and a sensible starting point. You’ll receive an honest assessment of whether and how in.hub fits your project.


Newsletter
The in.hub in.sights&tech.radar
Industry news and real-world insights from actual companies, every two to four weeks.